Data discovery
Map sources, ownership, refresh needs and the business questions a reporting system must answer.
 ichelonCONSULTING GROUP

Cloud, data & AI · Trace the source. Agree the measure. Improve the decision.
When every department has a different version of the numbers, decisions slow down. Start by agreeing what the numbers mean.
Understand the capability
Data and analytics bring information from operational systems into a consistent form for reporting and decisions. The central work is agreeing what a metric means, where its data comes from and who is responsible for its quality.
Consistent reporting supported by traceable, maintainable data flows.

Key takeaways
Where progress gets stuck
Departments use different definitions for the same measure.
Reports look current while their source data is stale.
Manual reconciliation becomes permanent work.
Dashboards present information without clarifying an action.
Make the problem and baseline visible before selecting a tool.
Design the workflow around real users and operating constraints.
Test important decisions, data and exception paths.
Leave an accountable owner and a practical handover.
What the work can include
Combine the capabilities the outcome requires. Each engagement is scoped around your existing systems, the team using them and the decisions they need to make.
Map sources, ownership, refresh needs and the business questions a reporting system must answer.
Move and transform information with validation, monitoring and recoverable processing steps.
Define consistent relationships, business metrics and rules for historical information.
Build role-appropriate views that help people identify a change and decide what to do next.
Make missing, stale or inconsistent information visible and assign responsibility for correction.
Explain definitions, train users and review whether reports support the decisions they were intended for.
Designed for the real world
Consistent reporting supported by traceable, maintainable data flows.
From understanding to action
 01
Map sources, ownership, refresh needs and the business questions a reporting system must answer.
 02
Move and transform information with validation, monitoring and recoverable processing steps.
 03
Define consistent relationships, business metrics and rules for historical information.
 04
Build role-appropriate views that help people identify a change and decide what to do next.
 05
Make missing, stale or inconsistent information visible and assign responsibility for correction.
Tools selected for the task


Technology choices follow the requirements, constraints and maintenance plan. Inclusion here describes tools that may be considered; the final stack is agreed in discovery.
How it works · Our method
 01
We talk to the people doing the work, map the current process and agree on the problem before recommending technology.
A shared problem statement and a map of the current workflow. 02
Establish a baseline. Identify the handoffs, bottlenecks and costs that make the biggest difference to your operation.
A baseline, prioritised opportunities and agreed success measures. 03
Turn the evidence into a practical plan. Evaluate options, dependencies and trade-offs, with your team involved throughout.
A delivery roadmap, solution design and acceptance criteria. 04
Deliver in reviewable increments. Test real workflows, handle exceptions and prepare your team to own the result.
Working software, tested integrations and a prepared team. 05
Review actual use against the baseline. Fix friction, refine the roadmap and adapt as your business changes.
An improvement backlog and an agreed review rhythm.Where we work
Start a conversation with Ichelon about your team, operating hours and delivery needs. Working arrangements, access and review rhythms are established as part of the engagement.
info@ichelon.com.au 0451 608 058Cost and engagement
Agree on the work before committing to delivery. Scope, timeline, ownership and dependencies belong in the same conversation as price.
Agreed after discovery
Make the current situation, options and next decision clear. A useful starting point when scope or dependencies are still uncertain.
Discuss the fitAgreed after discovery
Deliver an agreed set of capabilities with acceptance criteria, review points and a plan for handover.
Discuss the fitAgreed after discovery
Review how the result is used, address friction and prioritise the next changes against business outcomes.
Discuss the fitFrequently asked
Yes, after reviewing structure, ownership and reliability. Important spreadsheet inputs need validation and a plan for how they are updated and maintained.
Not always. The right architecture follows source complexity, volume, refresh needs and the decisions being supported. Start with a limited, useful data product where possible.
Agree on definitions, trace source data and add validation checks. Make refresh times and known limitations visible, and assign an owner to each critical measure.
We begin with the current situation, the outcome you need and the constraints around data & analytics. Discovery identifies dependencies, responsibilities and acceptance criteria before a delivery plan and quote are agreed.
The price depends on scope, integration needs, existing systems and the level of uncertainty. A focused assessment helps establish a realistic estimate. Any ongoing platform charges and third-party costs should be visible alongside delivery work.
The engagement is designed around your team’s context. We agree on the product owner, technical contacts, access, review points and handover responsibilities before implementation begins.
Related services
Learn more
AI · 1 min read
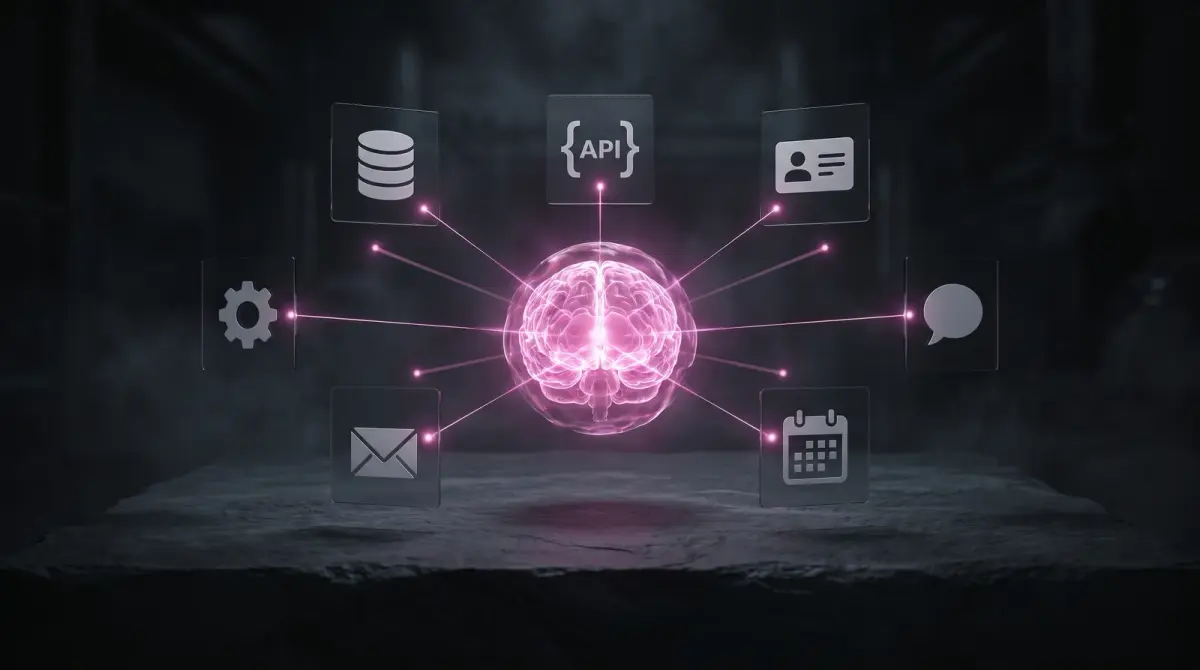
Permissions, evaluation and ownership matter as much as the model.
Read the perspectiveAI · 2 min read
The best starting point is often a bounded task with evidence, an owner and a way to judge the result.
Read the perspective
AI · 2 min read
A review step needs a decision, evidence and an owner. Adding an approval button is only the beginning.
Read the perspectiveLet’s move forward
Share the business challenge. We’ll establish the questions and next steps together.
Start the conversation